


In the past year, with Brexit and the premise of Donald Trump's winning campaign and some of the policies he has enacted since, all make a lot more sense when we look at them in the context of the graph above.
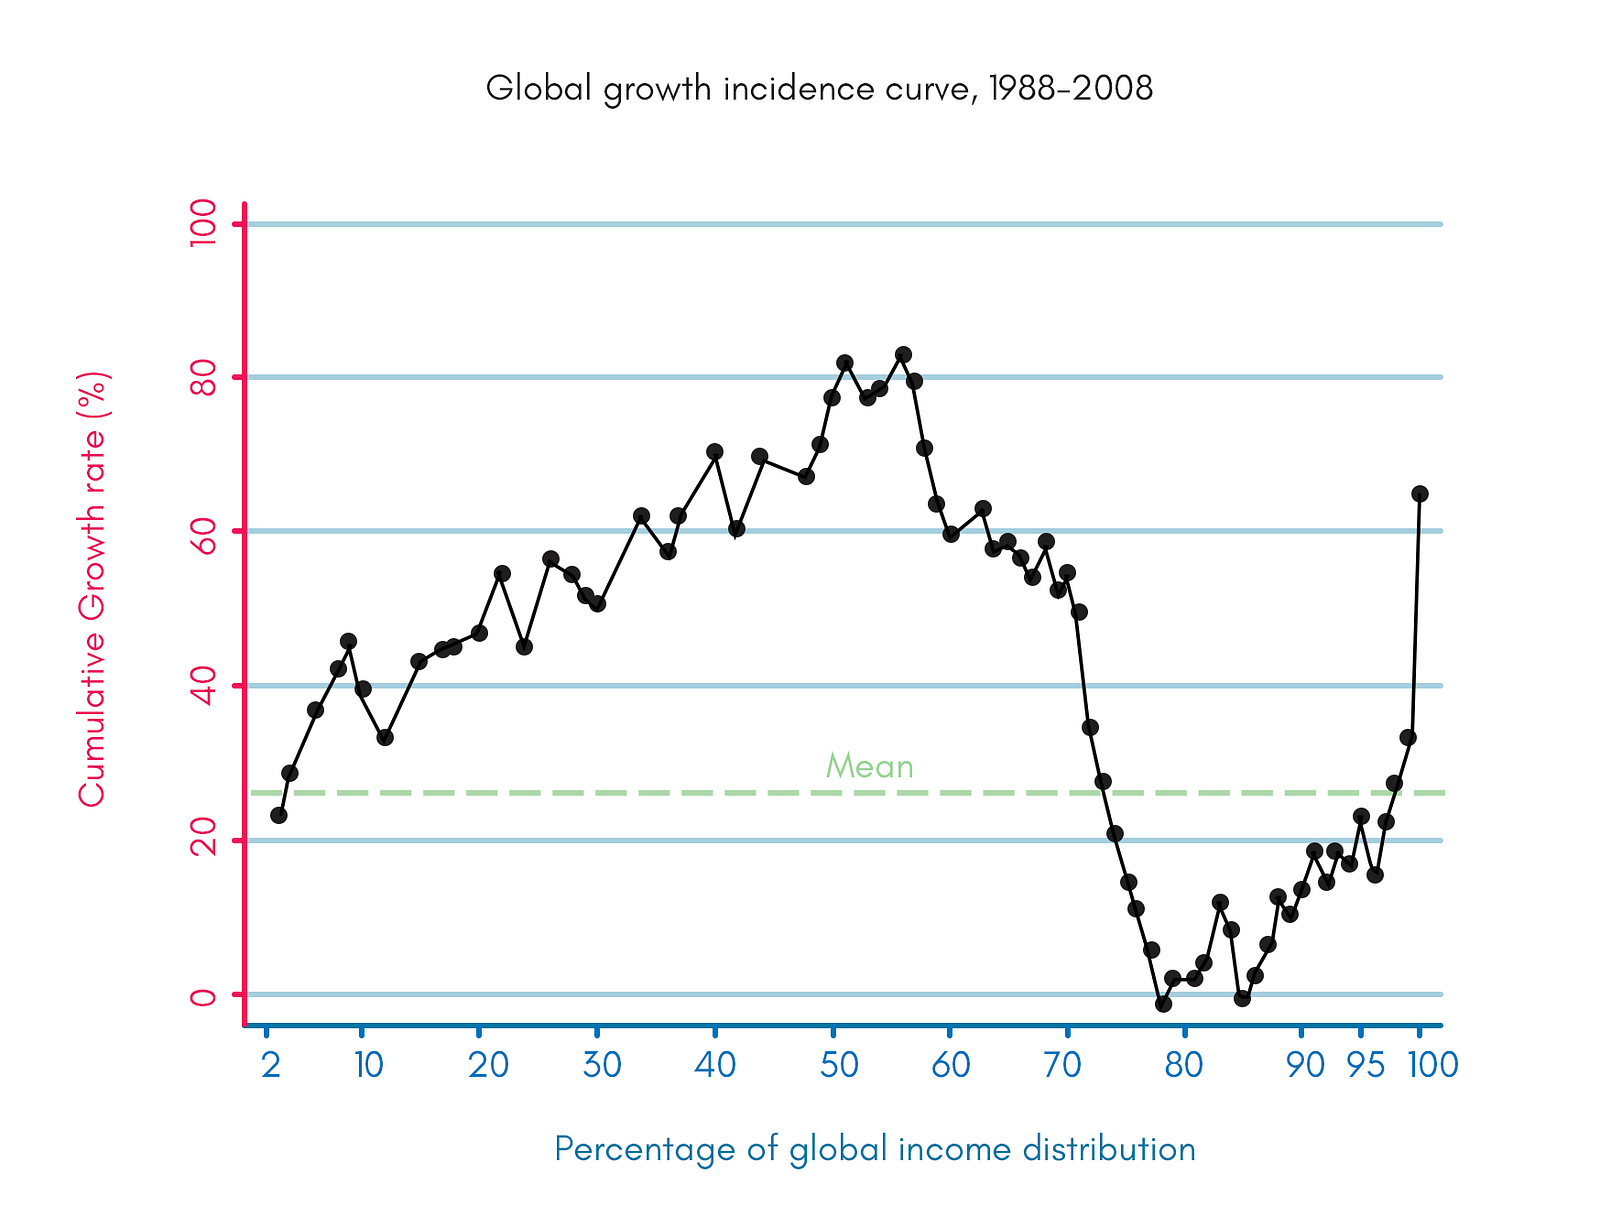
The graph describes the growth in income over a 20-year period for people across the world.
As you can see in the graph, the top 1% of the population have seen their incomes grow a good deal. This is growth driven by capital - owning of shares, real estate, etc. The 70-90 percentile is the poor in the western world. The incomes of this segment has pretty much stagnated for this period. And what's worse is it has grown for everyone else around them. Naturally, this class feels wronged and want to take back what they feel others have taken from them.
And that sentiment has been stoked again and again by opportunistic politicians like Donald Trump.
The 50-70 percentile that has seen good growth is the populations from emerging economies (China and India) where a lot of the manufacturing jobs have moved. Of course, their actual wages are still lower than the western poor, and that is the reason they are lower in percentile in the graph.
This trend is only going to continue as the top one percent that control the capital put pressure on companies and governments to grow their capital by cutting costs to increase profits which translates to moving jobs to people to the left of the graph.
The reason they don't go all the way to the left is because these jobs require some skill and not everybody on that graph has the requisite skills.
But, now there is a new form of pressure on this graph. And that is automation. It is soon becoming cheaper and cheaper to employ robots that do the jobs of these people. So far, the robots have been to the far right of this graph, which means that they cost a lot of money to employ and there have been cheaper alternatives available for companies. But as prices of robots come down, they will continue to move to the left of the graph until they are cheaper than everyone else. And then they will start moving up on the skill chart.
We already have robots that can clear university entrance exams (ones that include long written essays) at a rate higher than many high school graduates. So, knowledge work isn't exempt from automation.
It is very much possible that twenty years down, we will see a graph where the most part looks like the 70-90 percentile looks today while the top one percent that controls the capital will continue to see the same growth in their incomes.
A lot of people understand that this is happening. The whole movement around Universal Basic Income (an amount of money to cover basic necessities for all for free) has been gaining traction as a result.
But the majority that votes for making governments and presidents do not belong to the one percent that controls the capital. And they will continue to vote isolationist presidents and for strict borders until we do something to change the fabric of the society.
We are at the cusp of something bigger. And it is time we solve for it.
CONVERSATION