


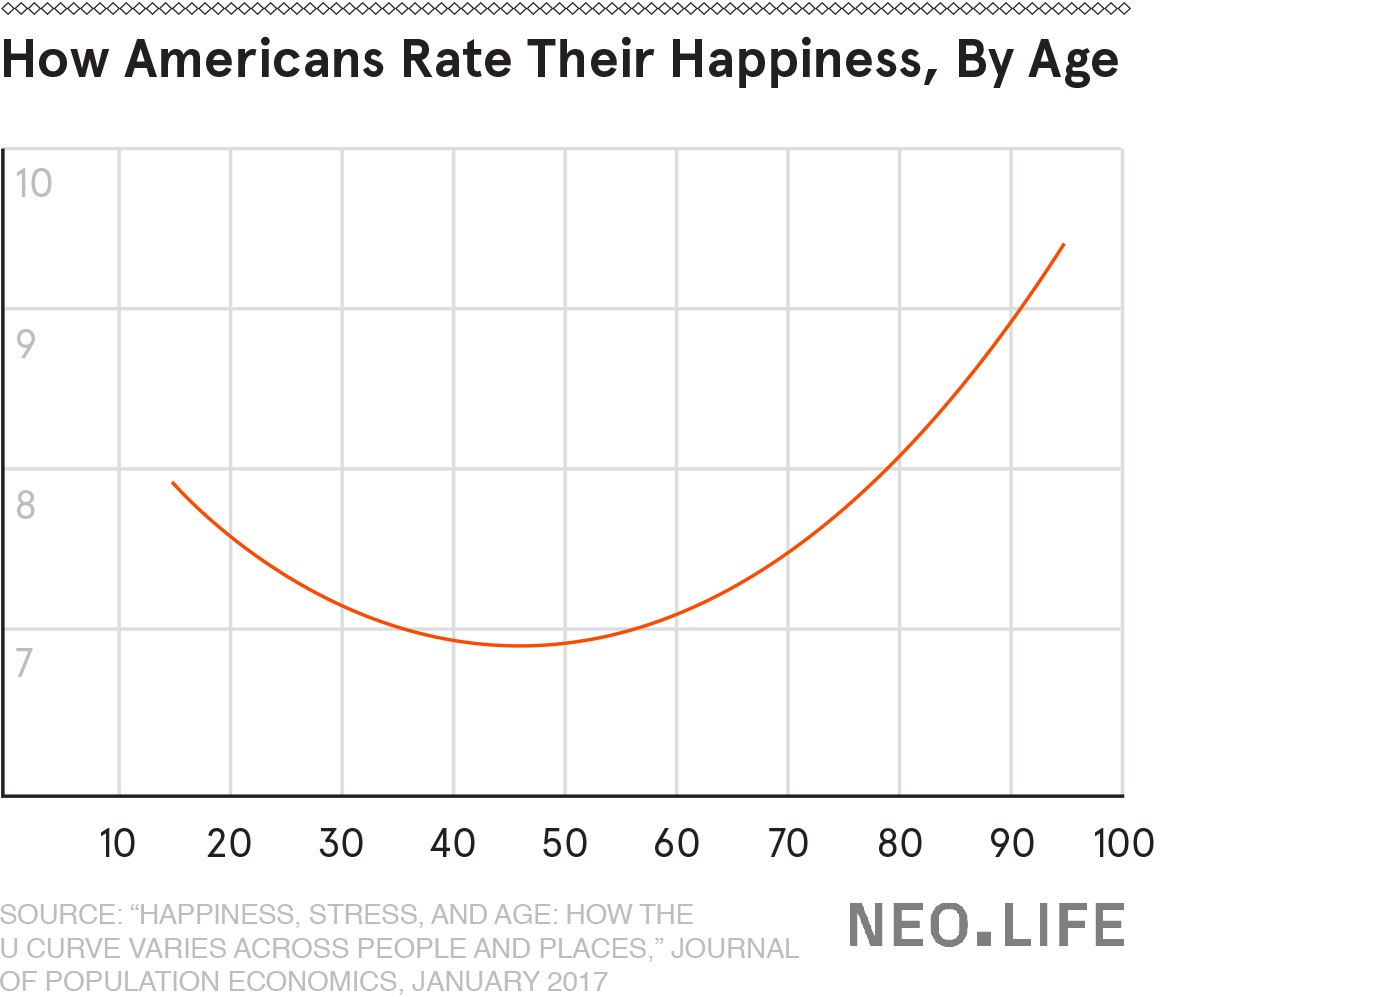
If you're reading my blog, you're very likely somewhere on that heavy downward slope of the happiness U curve. I'm somewhere there as well. I don't know if I conform to the slope of this curve. But I probably do. After all, most of as are, by definition, average.
The early teens and the years after sixty seem to be when people are at their happiest. They grow progressively less happier until they are about forty five years old and then they start reversing. Only in the final years before their deaths are they at their happiest.
This doesn't mean that people aren't happy in their twenties, thirties and forties. It just means that however happy they are during these years, they aren't as happy as they were in their early teens or in the years beyond sixty.
Part of my job as a Product Manager is to look at macro trends in data, observe patterns and draw hypothesis to understand why users behave the way they day and how I can make their lives better. Naturally, I was drawn to this graph when I saw it.
The big correlation here must be pretty obvious to spot. People seem to be happier when they are out of "the race". The race to score higher, the race to make more money, the race to get the next promotion, the race to buy a bigger apartment, the race to eat at a fancier restaurant, the race to buy designer clothes.
Of course, it is only a correlation. So, it is up to you to make what you want out of it.
CONVERSATION